- Accelerator/Decelerator Oscillator
- Accumulation/Distribution
- Alligator
- Average Directional Movement Index
- Average True Range
- Awesome Oscillator
- Bears Power
- Bollinger Bands
- Bulls Power
- Commodity Channel Index
- DeMarker
- Envelopes
- Force Index
- Fractals
- Gator Oscillator
- Ichimoku Kinko Hyo
- Market Facilitation Index
- Momentum
- Money Flow Index
- Moving Average
- Moving Average Convergence/Divergence
- Moving Average of Oscillator
- On Balance Volume
- Parabolic SAR
- Relative Strength Index
- Relative Vigor Index
- Standard Deviation
- Stochastic Oscillator
- Williams' Percent Range
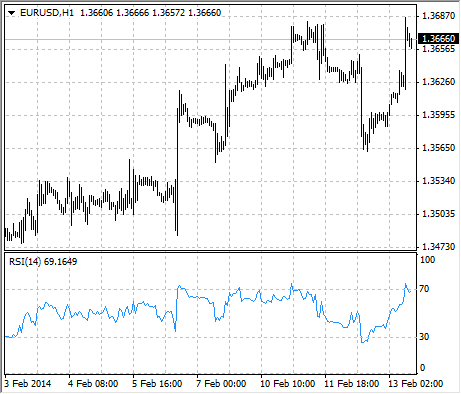
Relative Strength Index
The Relative Strength Index Technical Indicator (RSI) is a price-following oscillator that ranges between 0 and 100. When Wilder introduced the Relative Strength Index, he recommended using a 14-day RSI. Since then, the 9-day and 25-day Relative Strength Index indicators have also gained popularity.
A popular method of analyzing the RSI is to look for a divergence in which the security is making a new high, but the RSI is failing to surpass its previous high. This divergence is an indication of an impending reversal. When the Relative Strength Index then turns down and falls below its most recent trough, it is said to have completed a "failure swing". The failure swing is considered a confirmation of the impending reversal.
Ways to use Relative Strength Index for chart analysis:
- Tops and bottoms
The Relative Strength Index usually tops above 70 and bottoms below 30. It usually forms these tops and bottoms before the underlying price chart; - Chart Formations
The RSI often forms chart patterns such as head and shoulders or triangles that may or may not be visible on the price chart; - Failure swing (Support or Resistance penetrations or breakouts)
This is where the Relative Strength Index surpasses a previous high (peak) or falls below a recent low (trough); - Support and Resistance levels
The Relative Strength Index shows, sometimes more clearly than price themselves, levels of support and resistance. - Divergences
As discussed above, divergences occur when the price makes a new high (or low) that is not confirmed by a new high (or low) in the Relative Strength Index. Prices usually correct and move in the direction of the RSI.

Calculation
RSI = 100-(100/(1+U/D))
Where:
U – is the average number of positive price changes;
D – is the average number of negative price changes.